The last article in this series was a bit of a digression into the module pattern and namespaces in Javascript. This article will focus on a very simple charting algorithm.
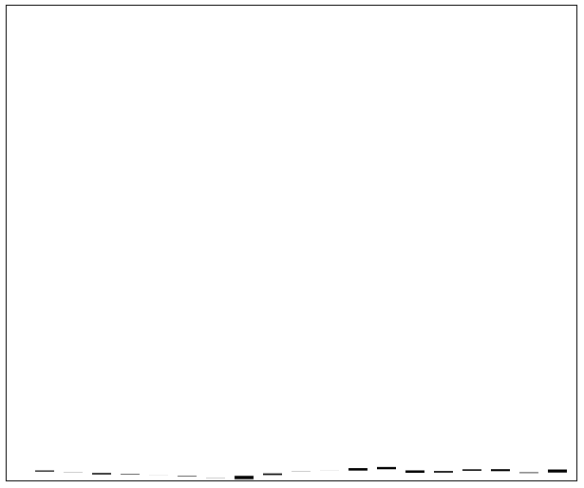
Now that we have the data to draw and know how to move things on the canvas, we need to focus on making the chart look more like a normal chart. This post will focus on the drawing algorithms that will turn our data into a nice display and redrawing that same chart at different time periods/scales. Here’s the screenshot representing our progress from last time.

The first step is to find out the lowest value that will have to be drawn on the chart. We can align all the rest of the values with the bottom of the chart if we subtract the lowest value from each value on the chart. To do this we first have to traverse the sequence of data that will be shown and look for the lowest value.
var width = 600, height = 500
var chart = document.getElementById("chart");
var c = chart.getContext("2d");
chart.width = width; chart.height = height

//___________________________________________________________________________//
// Query and Init Procedures
//___________________________________________________________________________//

function getUrl(symbol) {
  return "http://query.yahooapis.com/v1/public/yql?q=select%20*%20from%20csv%20where%20url%3D'http%3A%2F%2Fichart.finance.yahoo.com%2Ftable.csv%3Fs%3D" + symbol + "%26d%3D2%26e%3D27%26f%3D2011%26g%3Dd%26a%3D0%26b%3D1%26c%3D2000%26ignore%3D.csv'&format=json&callback=?";
}

$.getJSON(getUrl("ibm"), init);

function init(result) {
  var data = result.query.results.row;
  drawRects(data, 1);
}


//___________________________________________________________________________//
// Chart Drawing Procedures
//___________________________________________________________________________//

function drawRects(d, s) {
  var e = s + 30;
  var low = d[s].col3;

  for (var i = s; i < e; i++) {
    if (d[i].col3 < low) { low = d[i].col3 }
  }

  for (var i = s; i < e; i++) {
    c.fillRect(i*30, height-(d[i].col1-low), 20, d[i].col1 - d[i].col4);
  }
}
The next thing to do is scale up the bar heights to match the height of the chart. For this we also have to determine the highest high. Then we take the difference between the highest high and the lowest low and divide the chart height by that number, this gives us our multiple. Then we take the multiple and use it to compute the lower starting position as well as the height of each bar.
Before we were using the open data, however this won’t always give the lowest price. On any day the stock price fell, the open will represent the highest price. We don’t have to compute if the open is lower or higher than the close because our data gives us the low and high prices for the day. This is also beneficial as the low or high from the day could be significantly lower/higher than the open or close.
Also we’ve been drawing our chart backward, to flip it we need to subtract the offset from the width of the chart. In addition we should put in some color to tell what days are up or down. Since code is probably the best description of this formula I’ll stop trying to explain it and just show you the algorithm. I’m sure there is a cleaner/simpler solution (or maybe this solution is even too simple) however this can be updated a bit later down the road.
var width = 600, height = 500
var chart = document.getElementById("chart");
var c = chart.getContext("2d");
chart.width = width; chart.height = height

//chart.onclick = moveRects;


//___________________________________________________________________________//
// Query and Init Procedures
//___________________________________________________________________________//

function getUrl(symbol) {
  return "http://query.yahooapis.com/v1/public/yql?q=select%20*%20from%20csv%20where%20url%3D'http%3A%2F%2Fichart.finance.yahoo.com%2Ftable.csv%3Fs%3D" + symbol + "%26d%3D2%26e%4D04%26f%3D2011%26g%3Dd%26a%3D0%26b%3D1%26c%3D2000%26ignore%3D.csv'&format=json&callback=?";
}

$.getJSON(getUrl("ibm"), init);

function init(result) {
  var data = result.query.results.row;
  console.log(data[1].col0);
  drawRects(data, 1);
}


//___________________________________________________________________________//
// Chart Drawing Procedures
//___________________________________________________________________________//

function drawRects(d, s) {
  var e = s + 15;
  var low = d[s].col3;
  var high = d[s].col2;

  for (var i = s; i < e; i++) {
    if (d[i].col3 < low) { low = d[i].col3 }
    if (d[i].col2 > high) { high = d[i].col2 }
  }

  var mul = height / (high - low);

  for (var i = e; i > s; i--) {
    if (d[i].col1 < d[i].col4) { c.fillStyle = "#00f"; }
    else { c.fillStyle = "#f00"; }
    c.fillRect(width - (i*30),
               height - (mul * (d[i].col1-low)),
               20,
               (mul * (d[i].col1 - d[i].col4)));
  }
}

And here’s the Yahoo Finance chart as comparison…

Finally here’s a snapshot of pyTrade, the father of JamochaTrade. Something similar to this is the ultimate goal of JamochaTrade.

As you can see our chart now looks a lot more like a stock chart! However, we still have a long way to go. Wicks, labeled axes, hover tags and much more need to be added, not to mention different styles of charts (line, mountain, dot, etc.). There are also a few bugs with our current implementation that need to be worked out.
The next article will concentrate on refactoring and debugging. Notably we’ll move our code into a namespace, as was discussed in the previous article. We’ll also rip out the drawing logic and put it into a function so we can make a more general drawing procedure that can handle different types of bar charts (Candlestick, OHLC, HLC).
Get JamochaTrade on GitHub
